I would like to introduce you to some concepts related to system monitoring and demonstrate how you can gather and analyze metrics from your installation of EventStoreDB using Prometheus and Grafana.
A bit of background
When you put a system in Production, you need to know if it is up and running at all times, no question about that. But what does "up and running" mean? This of course varies from case to case, but in most scenarios you would like to know that:
- the system can be accessed by the users or other actors
- it is able to perform functions it was designed for
- the performance meets some established baseline
- there is no indication that the situation might change for the worse in the nearest future
- and if it does change, you want to be notified about it
There are various tools and techniques you could employ to check off the items from the list above. In most cases they involve gathering various types of data: logs, traces, metrics, smoke test results, and then running some kind of analysis on them. Here, I would like to focus on the metrics: how to extract them from EventStoreDB and what information you can get from them. Metrics are time series: numeric values registered over time, preferably at constant interval. One simple example is CPU usage over time; having such a chart is quite useful for monitoring VM performance, right? In fact, a proper set of metrics can tell you a lot about system health. At the same time, they are quite cheap to produce, collect, store and analyze.
Why Prometheus and Grafana?
There are many monitoring tools, but Prometheus and Grafana is a truly outstanding duo. You might consider using these tools because:
- they provide advanced analysis capabilities
- they are open source and have large and active communities
- Prometheus is deeply integrated with Kubernetes ecosystem
Let's take a look at a typical monitoring setup:

You can think about Prometheus as of a time series database combined with a data ingestion mechanism. Prometheus will call configured metrics endpoints on interval. Here you can see two custom built services exposing metrics in the Prometheus format. Prometheus then stores the retrieved metrics data with a timestamp and makes it available for querying. Grafana is a visualization web application, that can call Prometheus (among other sources) to retrieve data, transform it, and display in the form of charts, tables and custom dashboards. It can also monitor thresholds you set up and issue alerts if they are violated.
What is a Prometheus exporter?
You probably noticed when I mentioned that Prometheus format is required on the metrics endpoint. It is easy to ensure proper metrics formatting if you control the monitored component and you can make changes to it. This is not always the case of course. Let's say you have a database you would like to monitor (like EventStoreDB) that does not expose Prometheus formatted metrics. At the same time it exposes quite a lot of diagnostic information in a custom JSON format.
Here's where Prometheus exporters come in. They are adapters, that translate metrics format of a component you're dealing with to the Prometheus format.

There is a long list of readily available exporters in the official documentation and even longer one in the wiki. Some of these exporters even come with a predefined dashboard for Grafana. Nice!
Quick setup with Docker Compose
Let's take a look at how you could setup monitoring of EventStoreDB with Prometheus, Grafana and EventStoreDB Prometheus exporter. We will put all the components in single Docker Compose file for simplicity. But first, we need a little bit of Prometheus configuration in prometheus.yml file:
global:
  scrape_interval: 15s

scrape_configs:
- job_name: eventstore-exporter
  static_configs:
  - targets: ['eventstore-exporter:9448']
Here we set scraping interval to 15s and we configure single metrics endpoint, the exporter URL. Now to define the environment in docker-compose.yml:
version: "3"

services:

  eventstore:
   image: eventstore/eventstore:21.2.0-buster-slim
   environment:
   - EVENTSTORE_INSECURE=True
   ports:
   - 2113:2113

  eventstore-exporter:
    image: marcinbudny/eventstore_exporter:0.10.1
    environment:
    - EVENTSTORE_URL=http://eventstore:2113
    ports:
    - 9448:9448

  prometheus:
    image: prom/prometheus:v2.26.0
    command:
    - --config.file=/etc/prometheus/prometheus.yml
    volumes:
    - ./prometheus.yml:/etc/prometheus/prometheus.yml
    ports:
    - 9090:9090

  grafana:
    image: grafana/grafana:7.5.2
    environment:
    - GF_AUTH_ANONYMOUS_ENABLED=true
    - GF_AUTH_ANONYMOUS_ORG_ROLE=Admin
    ports:
    - 3000:3000
If you now run docker-compose up -d you will have a functioning monitoring environment. Let's verify if everything works as intended. Visit http://localhost:9448/metrics to see metrics produced by the exporter. You should get something like:
# HELP eventstore_cluster_member_alive If 1, cluster member is alive, as seen from current cluster member
# TYPE eventstore_cluster_member_alive gauge
eventstore_cluster_member_alive{member="127.0.0.1:2113"} 1
...
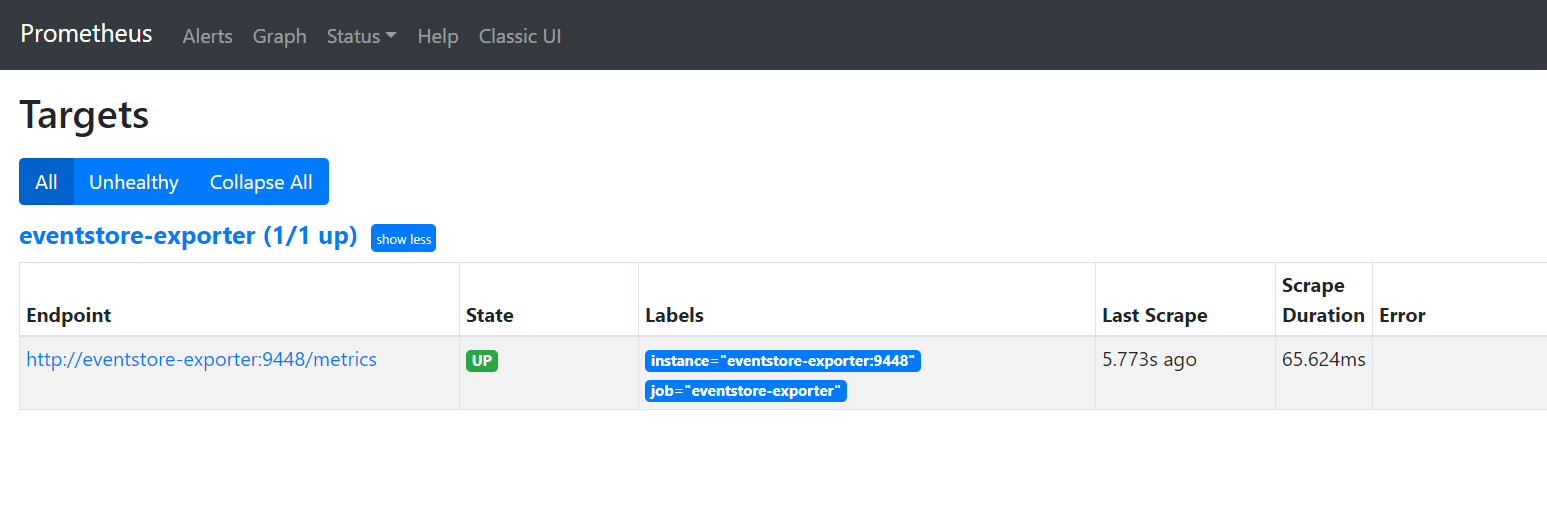
As you can see, Prometheus uses a simple text-based format for metrics. Now visit http://localhost:9090/targets to see that Prometheus is successfully scraping the exporter endpoint:
One last piece of the puzzle is the Grafana dashboard. To visualize metrics from EventStoreDB exporter, you can use the one available in the dashboards repository. To access Grafana open http://localhost:3000.
In Grafana, you have to:
- Add a Prometheus data source pointing to
http://prometheus:9090 - Import the dashboard providing its ID
7673(Grafana will download it from the repository).
Instead of doing this through GUI, you can run these commands:
# add Prometheus datasource
curl -X POST http://localhost:3000/api/datasources \
    -H "Content-Type: application/json" \
    -d '{"name": "Prometheus", "type": "prometheus", "url": "http://prometheus:9090", "access": "proxy"}'

# add the dashboard
json=$(curl -s https://grafana.com/api/dashboards/7673/revisions/7/download)

echo "{\"dashboard\":$json,\"overwrite\":true, \"inputs\":[{\"name\":\"DS_PROMETHEUS\", \"type\":\"datasource\", \"pluginId\":\"prometheus\", \"value\":\"Prometheus\"}]}" > req.json

curl -X POST http://localhost:3000/api/dashboards/import \
    -H "Content-Type: application/json" \
    -d @req.json
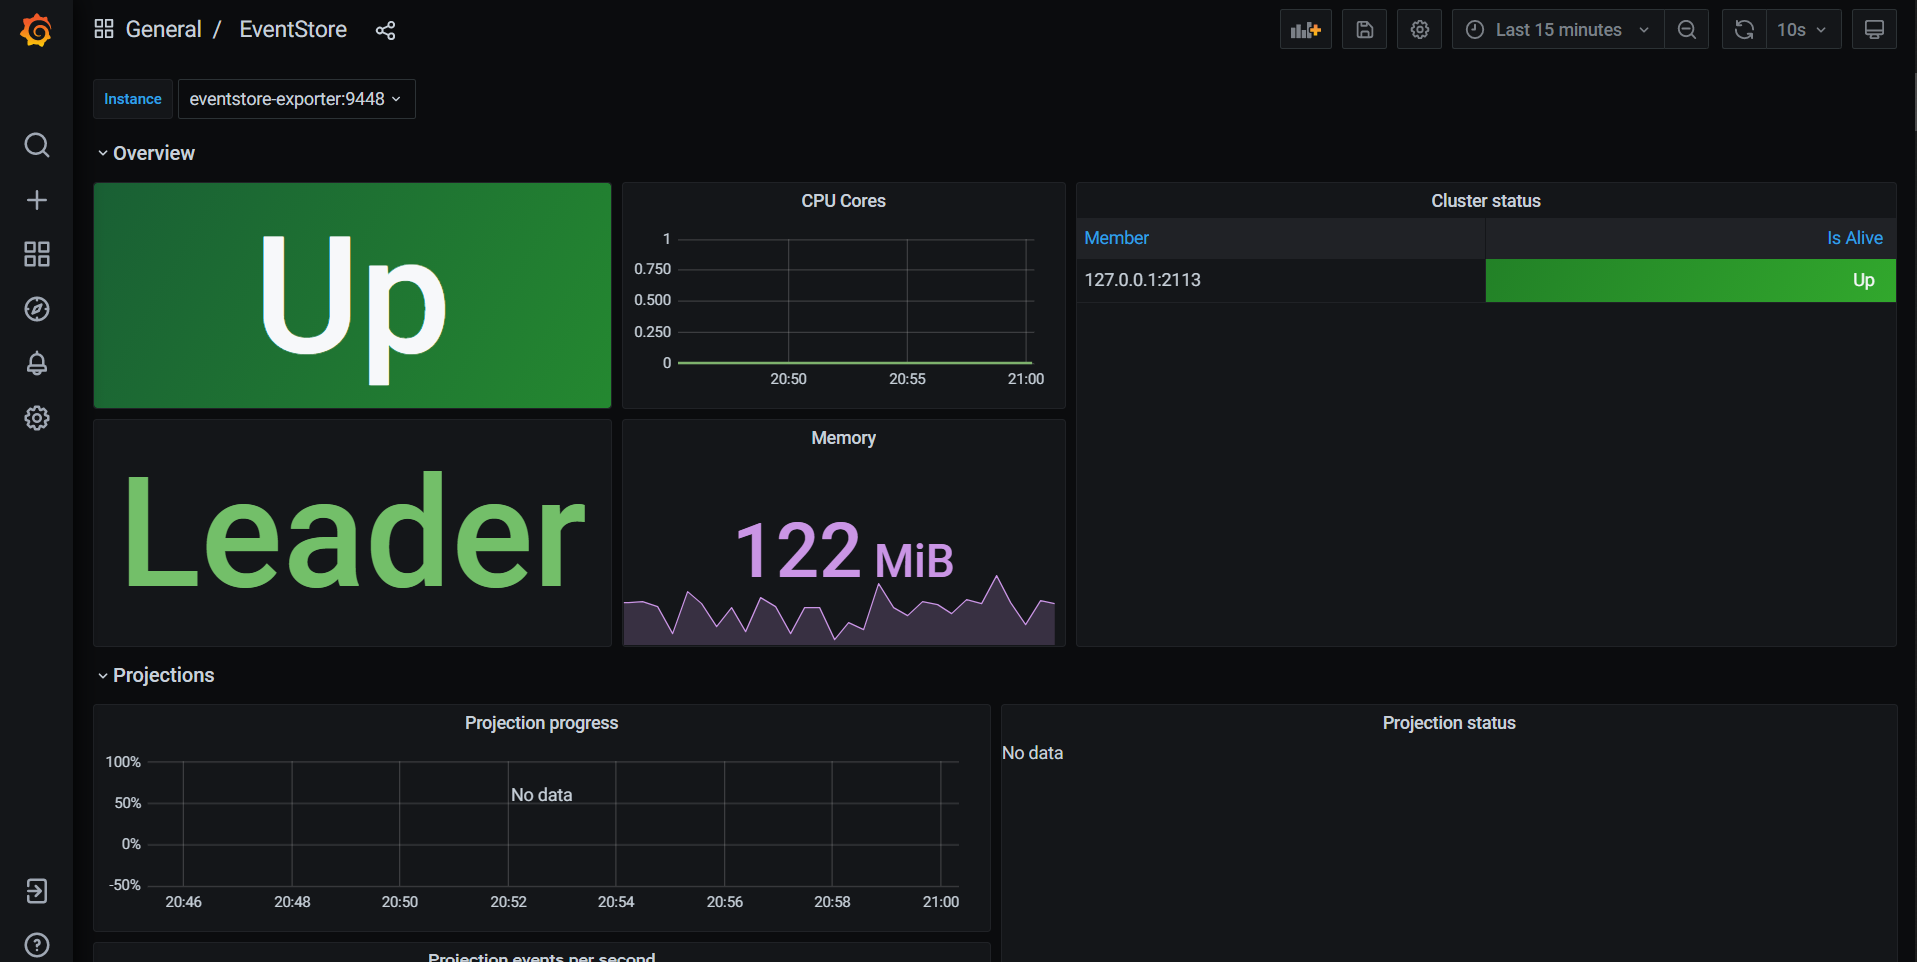
Now you should be able to open the dashboard in Grafana:
What monitoring information can I get from EventStoreDB?
Depending on the EventStoreDB and exporter configuration, you will get different monitoring data. Full list of the metrics with explanation is available in the exporter readme. Here are some highlights:
- The eventstore_up metric is the most basic one. It has a value of 1 if the exporter was able to connect to diagnostic endpoints of EventStoreDB and scrape them. If that is the case, it is highly probable that the database is up and running.
- Metrics related to CPU and memory usage, as reported by EventStoreDB. They may not be relevant if you are also monitoring the host machine with node_exporter (Linux) or windows_exporter (Windows).
- Metrics related to cluster environment. The status of the monitored cluster node (e.g. leader, follower) and the visibility of other cluster members from that node. Please note that single exporter instance is capable of monitoring a single cluster node. You will need more exporter instances to monitor all the nodes.
- Projection status, progress and processing rate.
- Persistent subscription status per consumer group, including information required to calculate the gap between consumer position and the stream end. This also includes information about parked messages.
- Networking information: amount of received and sent data, number of connections.
- Disk information: amount of data read and written. Also space left on the data disks, as reported by EventStoreDB
The list above is quite extensive and I think such monitoring data will give you a good overview of the database health. The metrics provided by the exporter are raw data, while the Grafana dashboard attempts to "make sense of it". If you are interested in the details, please take a look at the queries the dashboard makes.
Some Tips
Secured installation
The example in this post uses insecure mode of EventStoreDB for simplicity. When working with a production deployment, specify connection credentials in exporter configuration and optionally set INSECURE_SKIP_VERIFY flag if you are using self-signed certificates.
Monitoring the whole cluster
As mentioned, you will need one exporter instance per cluster node. By default, the Grafana dashboard uses the instance label to switch between nodes. This label is automatically assigned by Prometheus. It is a bit confusing though, since instead of selecting the ESDB node address in the dashboard, you are selecting exporter address. Fortunately, this can be easily fixed by overwriting the instance label or adding some other label to the job definition in Prometheus configuration.
Prometheus autodiscovery
Prometheus has an advanced auto-discovery mechanism for metrics endpoints, with implementation for Kubernetes and various cloud providers. It is much more convenient to use than manual job configuration. Read about it in the documentation.
Cluster vs single-node installation
EventStoreDB versions prior to 21.2 have a quirky behavior when calling /gossip endpoint in a database installation that is configured to a single node. That is why the exporter expects you to set the CLUSTER_MODE variable to single in such cases.
Parked messages
Gathering parked messages metrics can result in quite a few requests if you have a lot of subscriptions and consumer groups. That is why you have to opt-in by setting ENABLE_PARKED_MESSAGES_STATS to true.
Subscription lag
EventStoreDB cannot track the regular (non-persistent) subscription lag for you, therefore the exporter does not provide this metric. But here's an idea: in your service, create custom metrics for: 1) subscribed stream end position 2) current subscription checkpoint. If you substract 2) from 1) in the dashboard query, you will get the subscription lag.
Take matters into your own hands
Remember you can configure the Grafana dashboards however you like, using the existing dashboard as a starting point. You could e.g. combine metrics from your application, ESDB and host machine (via node_exporter or windows_exporter) on a single dashboard.
Summary
In this post I attempted to convince you to start monitoring your EventStoreDB installation with Prometheus and Grafana. Don't stop there however. With all the different exporters available, you can easily cover most of your infrastructure with advanced monitoring and alerting.