In EventStoreDB v23.6 we made it much easier to collect and process key metrics from the server. This feature is now supported in the EventStoreDB v23.10 LTS release.
Metrics in Prometheus format can be scraped directly from the server's /metrics endpoint, with no need for a separate exporter process, and no need to parse the stats files. By default, Prometheus will need to be provided with EventStoreDB login credentials, but this can be disabled in the server configuration.
In this blog post, we'll take a peek at some preview dashboards that we have created to show some of the metrics and how they can be used.
The metrics can be enabled and disabled fairly granularly, but the default settings should be appropriate for most users. The full documentation is also available.
Metrics for Projections and Persistent Subscriptions are expected to be added in a later version. For now, these can still be collected with the EventstoreDB Prometheus exporter.
Summary Dashboard Preview
The Summary Dashboard Preview shows a number of key metrics relating to the overall health of the cluster. If there is a problem with the cluster, it is likely to be visible on this dashboard.
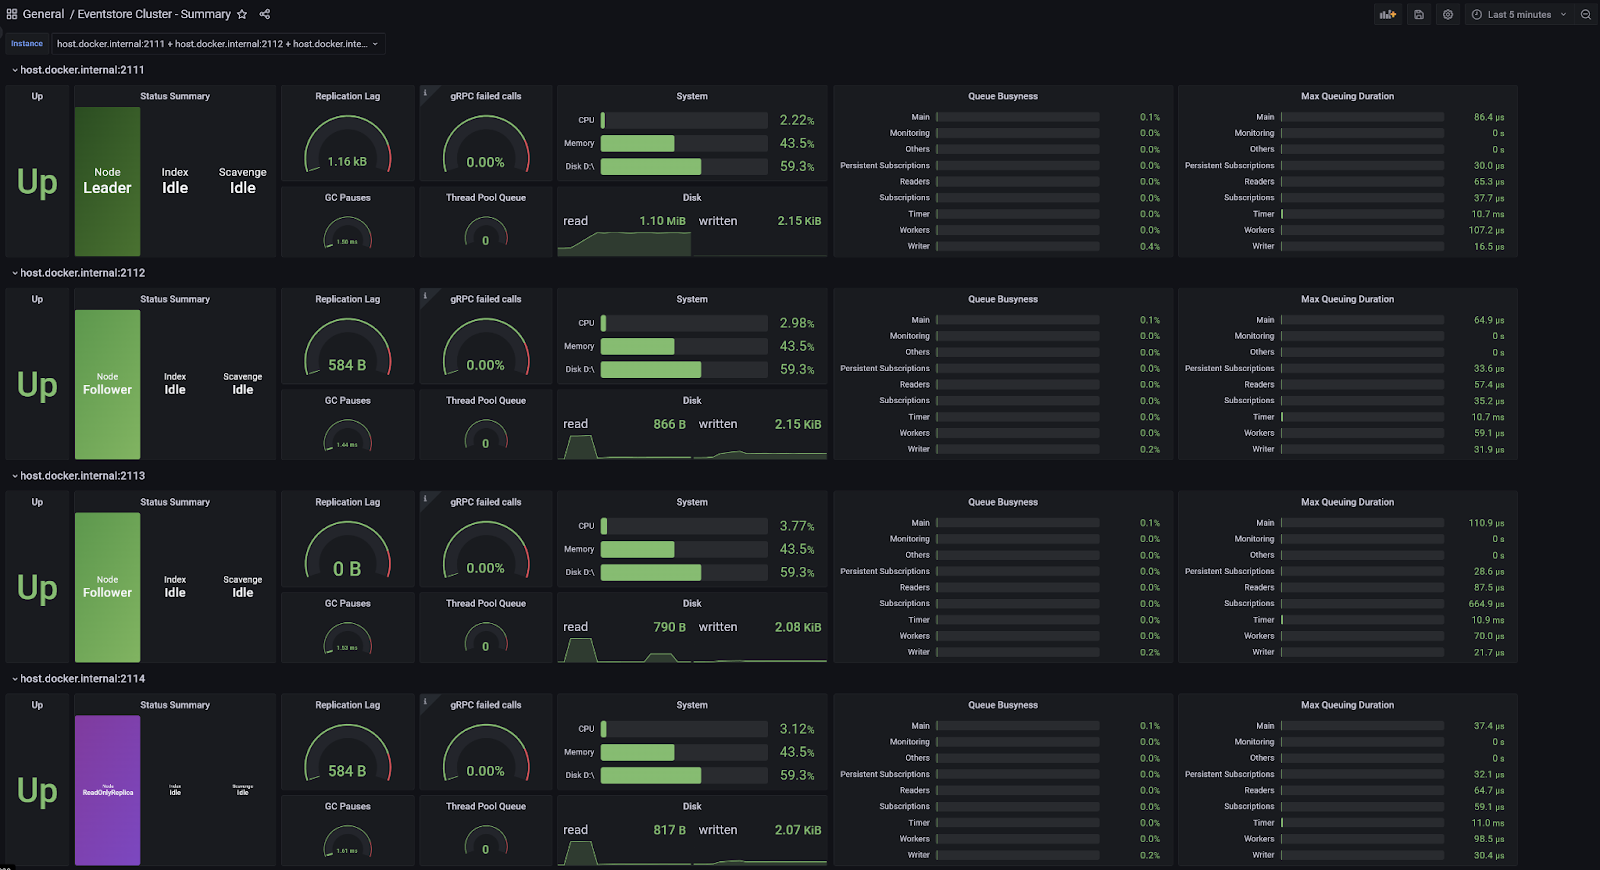
Some of the interesting metrics displayed for each node include:
The state of the node
In a healthy cluster, all the nodes settle into one of the states: Leader, Follower or ReadOnlyReplica. If they don't it may be an indication of a network connectivity problem, a configuration problem, or other environmental problem.
Whether there is an active index operation (merge or scavenge)
These place additional load on a node and could explain temporarily reduced performance.
Whether there is currently a scavenge running and what phase it is in
This also places additional load on a node and could explain temporarily reduced performance. If this is a concern for you then it is recommended to run scavenge on one node at a time, pause it during peak times, or make use of the throttle feature to reduce its impact.
How far behind the leader the node is for replication
In a healthy cluster, all nodes should be not far behind the leader for replication. If a node has been restored from an older backup it will be behind the leader and you should see it catching up. If a node is gradually falling further behind it may be an indication that the node is under-provisioned compared to the other nodes, or is experiencing some other problem.
Disk space and throughput
Keep an eye on available disk space because the nodes cannot function without free disk space, and typically if one node is running out of disk space they all are.
Disk throughput is also interesting to watch. It may be that the load is not evenly spread across the cluster, or disk throughput is a lot higher or lower than you were expecting. This should be considered in conjunction with the IOPS and throughput limits that your environment may impose on your disk or VM.
Queue Stats
The dashboard shows how busy the queues are (% active vs idle) and how long they are in seconds (specifically, for a non-empty queue, this is a recent maximum of how long items dequeued from the queue spent in the queue)
Long queues or excessively busy queues could be a sign that the server is overloaded. Consider increasing the resources of the VM, and check that you have a suitable retry policy.
Panels Dashboard Preview
The Panels Dashboard Preview just contains a number of sample panels that you can use as a starting point to build into your own dashboards according to your needs. They are arranged into sections.
Caches
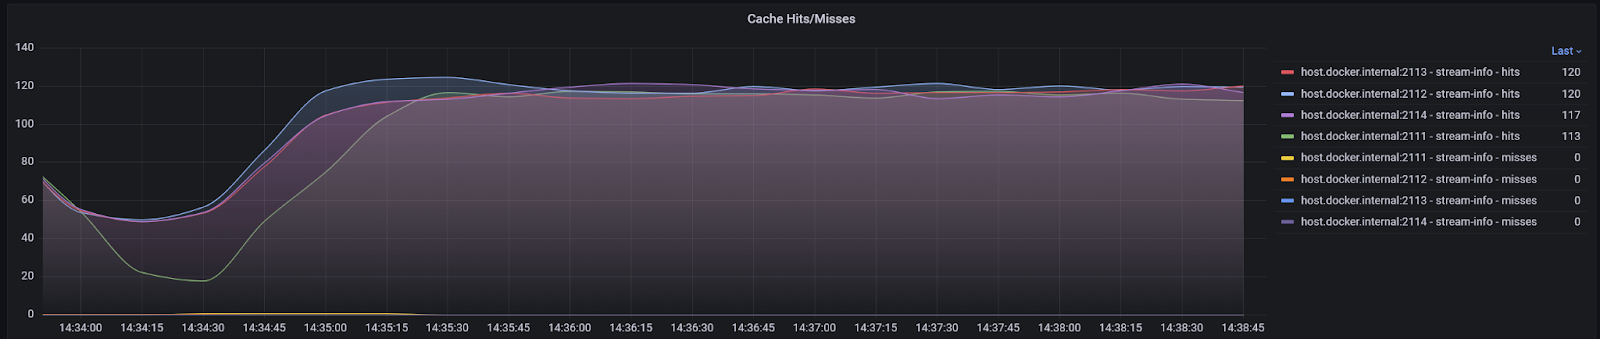
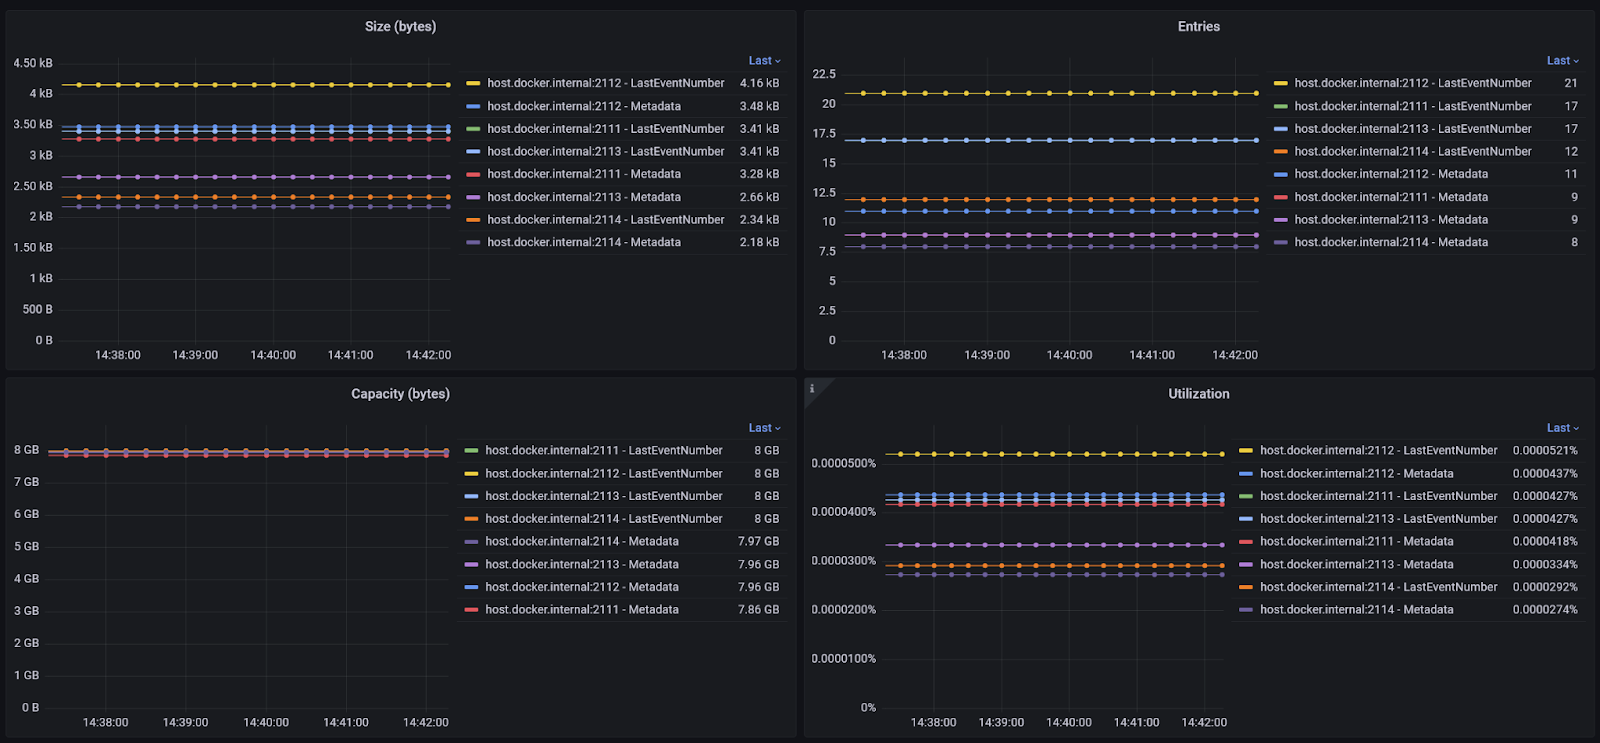
The cache hits and misses are available, as well as the number of entries and the approximate size in bytes of the caches. The capacity is the size that the cache is allowed to grow to. By default, this resizes dynamically according to available memory, but it can be configured to be a specific value.
If you are experiencing a high number of stream info cache misses, it may be that increasing the size of this cache will help performance. If you have a low number of misses it may be that decreasing the size of the cache may help performance by freeing up memory for other purposes and reducing pressure on the garbage collector. Usually, a good setting for the stream info cache capacity is 2x the number of streams that are regularly accessed. This leaves room for the streams themselves and their corresponding metadata.
Checkpoints
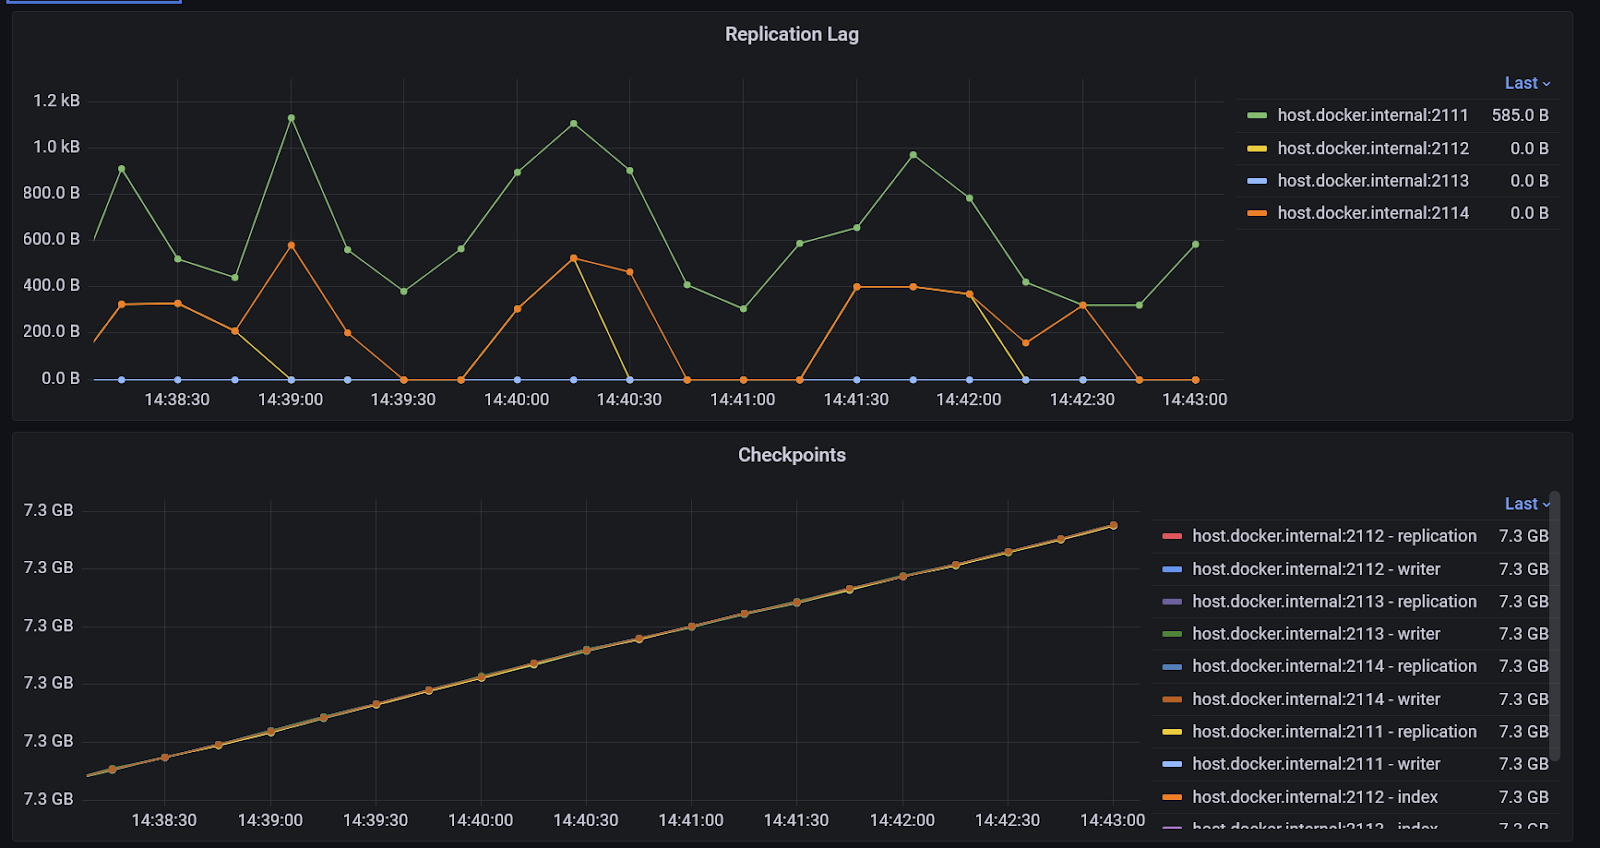
All the checkpoints can be observed as metrics. In practice this allows you to see how much data is being written to the log, and whether any nodes are becoming significantly behind the others.
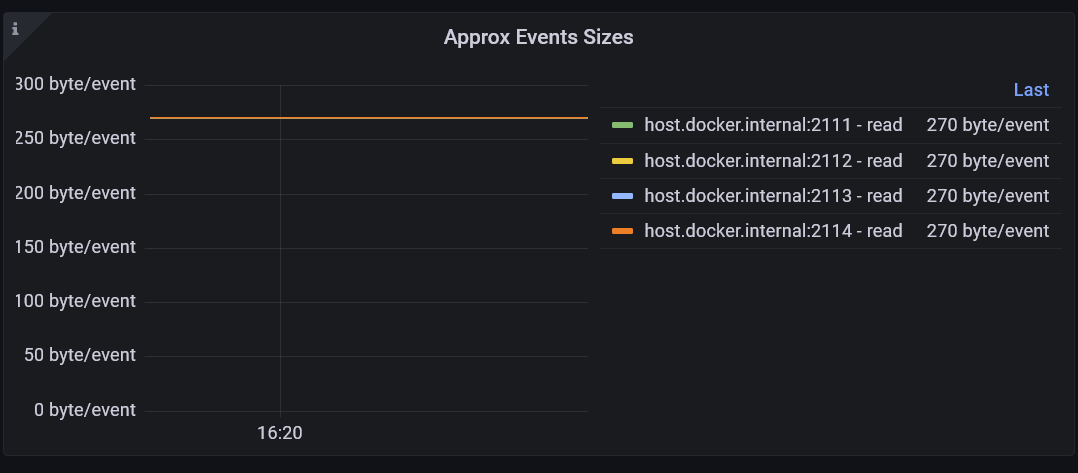
Events Served
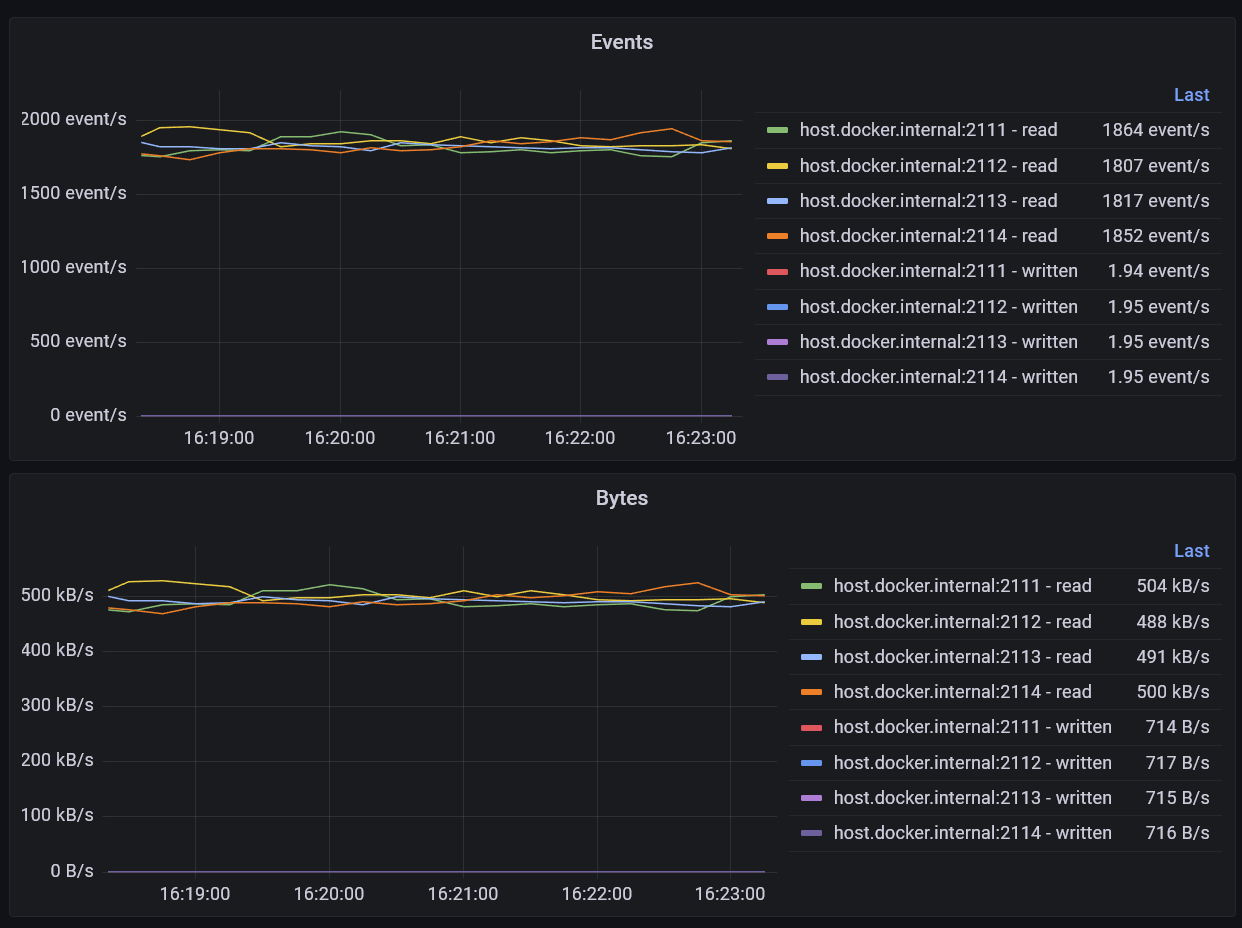
These are the number of events read or written by the server. Reads from memory rather than disk are included. The number of bytes in the event payloads is also tracked, and this can be used to calculate the average size of the events being read and written.
Gossip
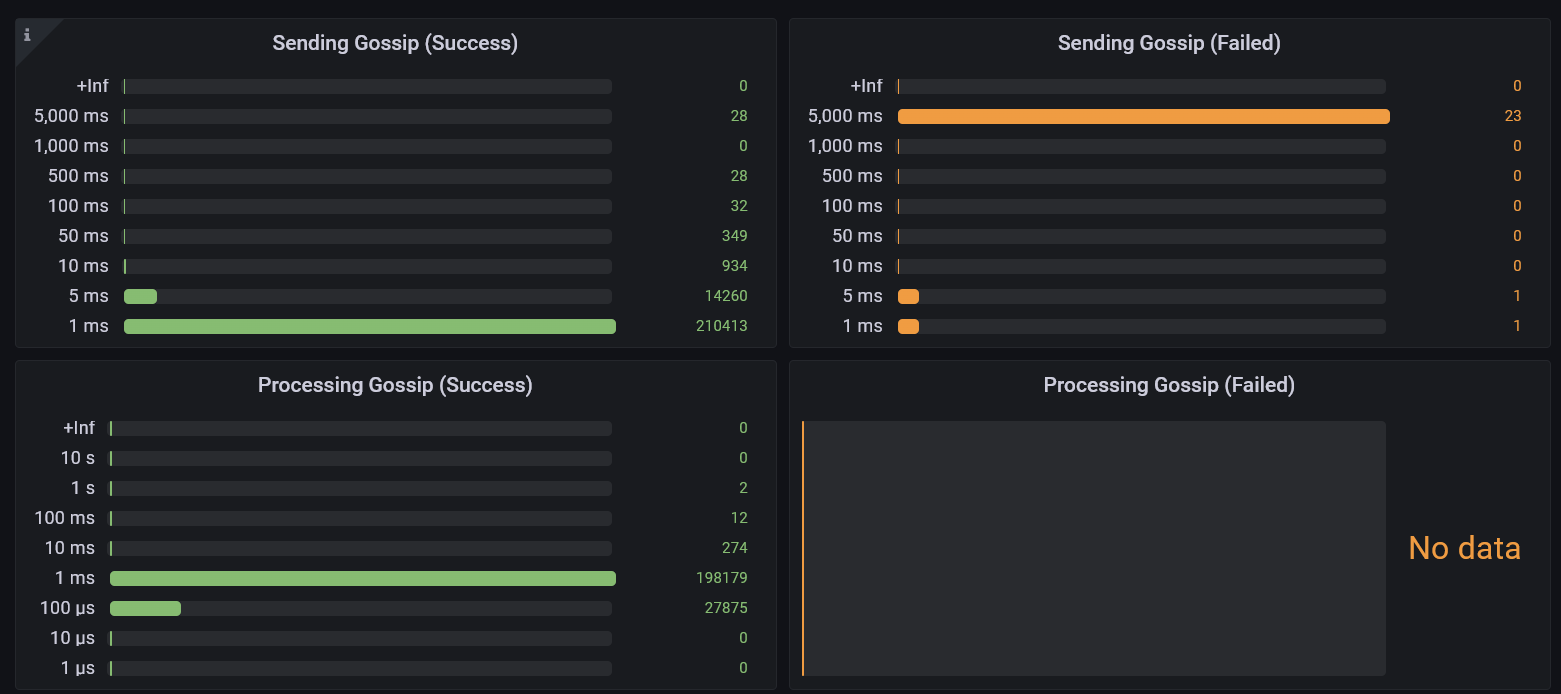
Several histograms are available showing how long it takes to send gossip and process it. Each bucket is a count of the number of items that took less than or equal to the amount of time specified by the bucket, but greater than the next bucket down.
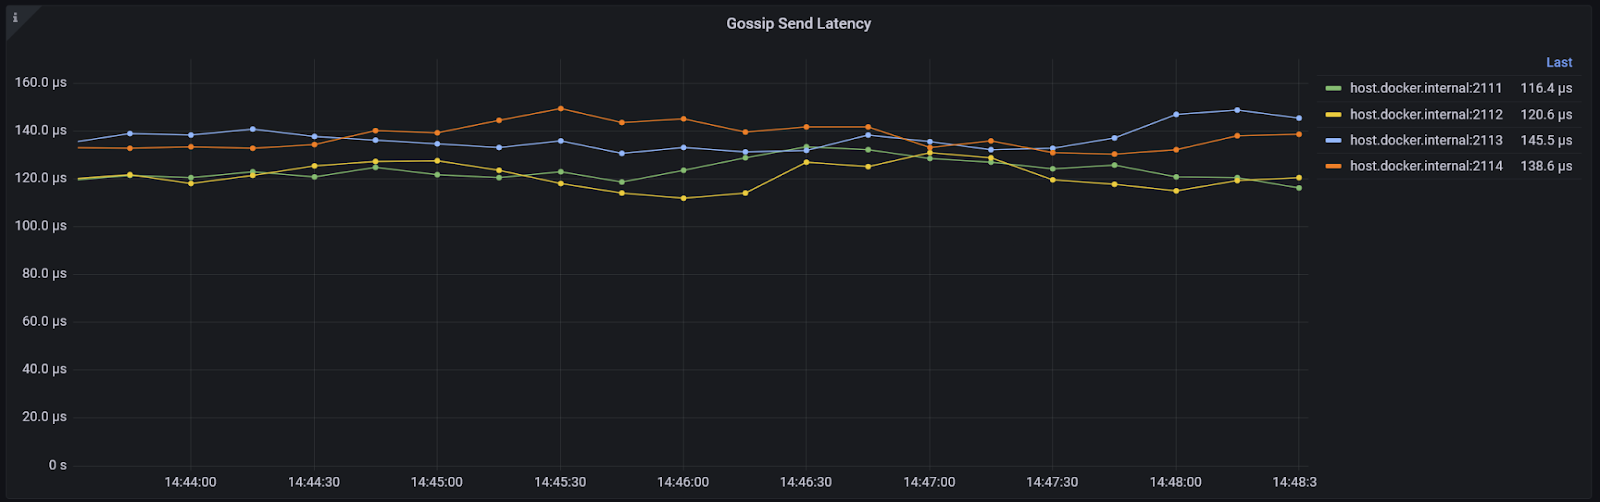
The latency over time is also shown (behind the scenes this is also a histogram, the graph is calculated using the sum and the count)
Together these can help determine a reasonable gossip timeout setting for your environment and also to detect if network problems might be interrupting the nodes' ability to communicate with each other.
Incoming gRPC & HTTP
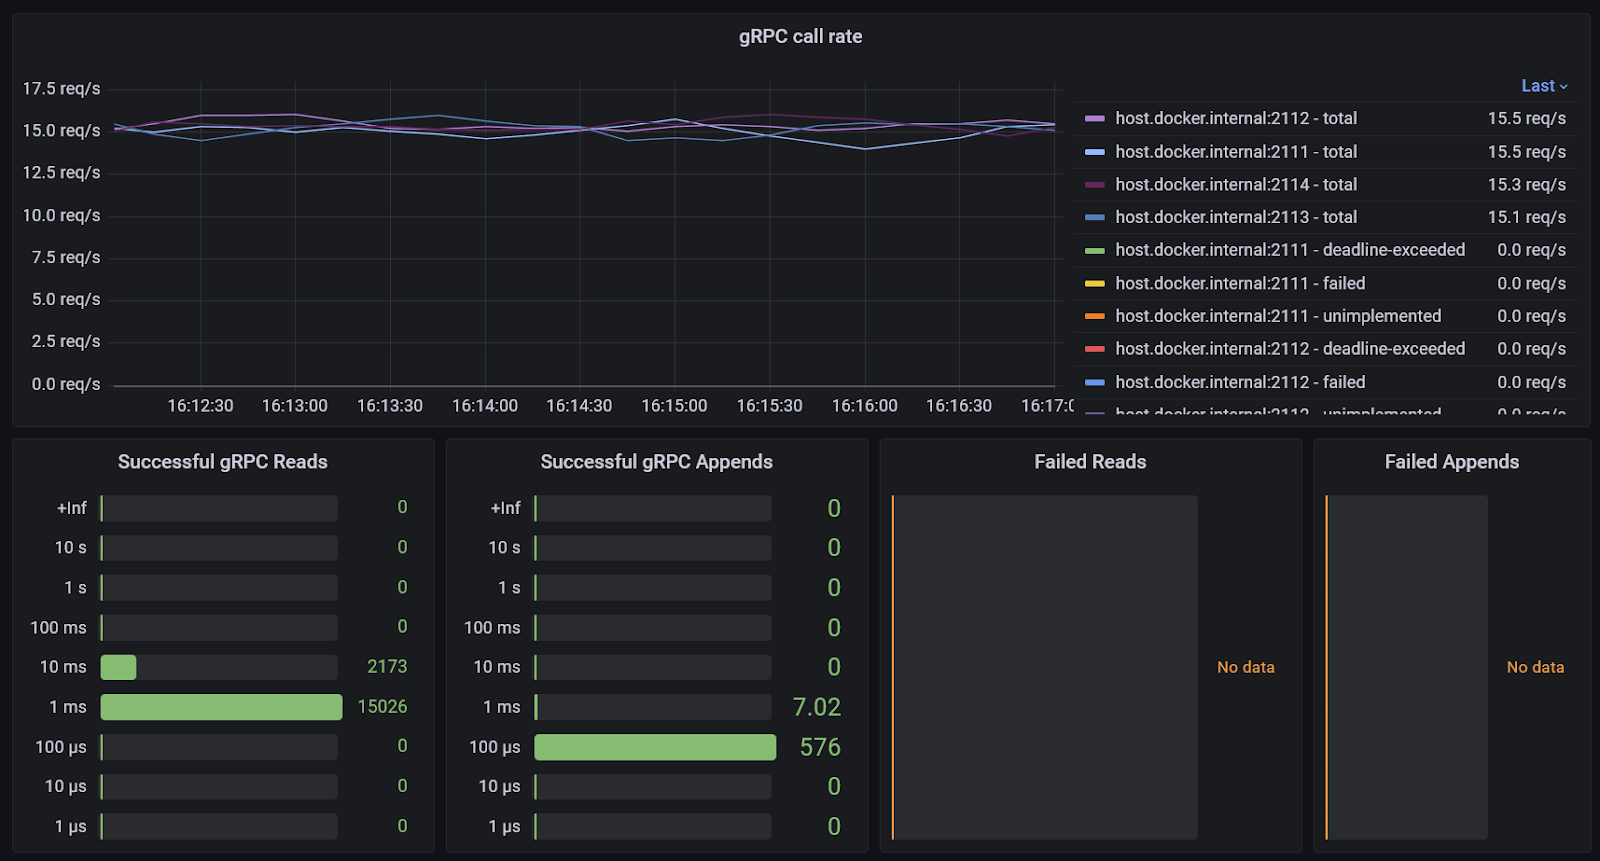
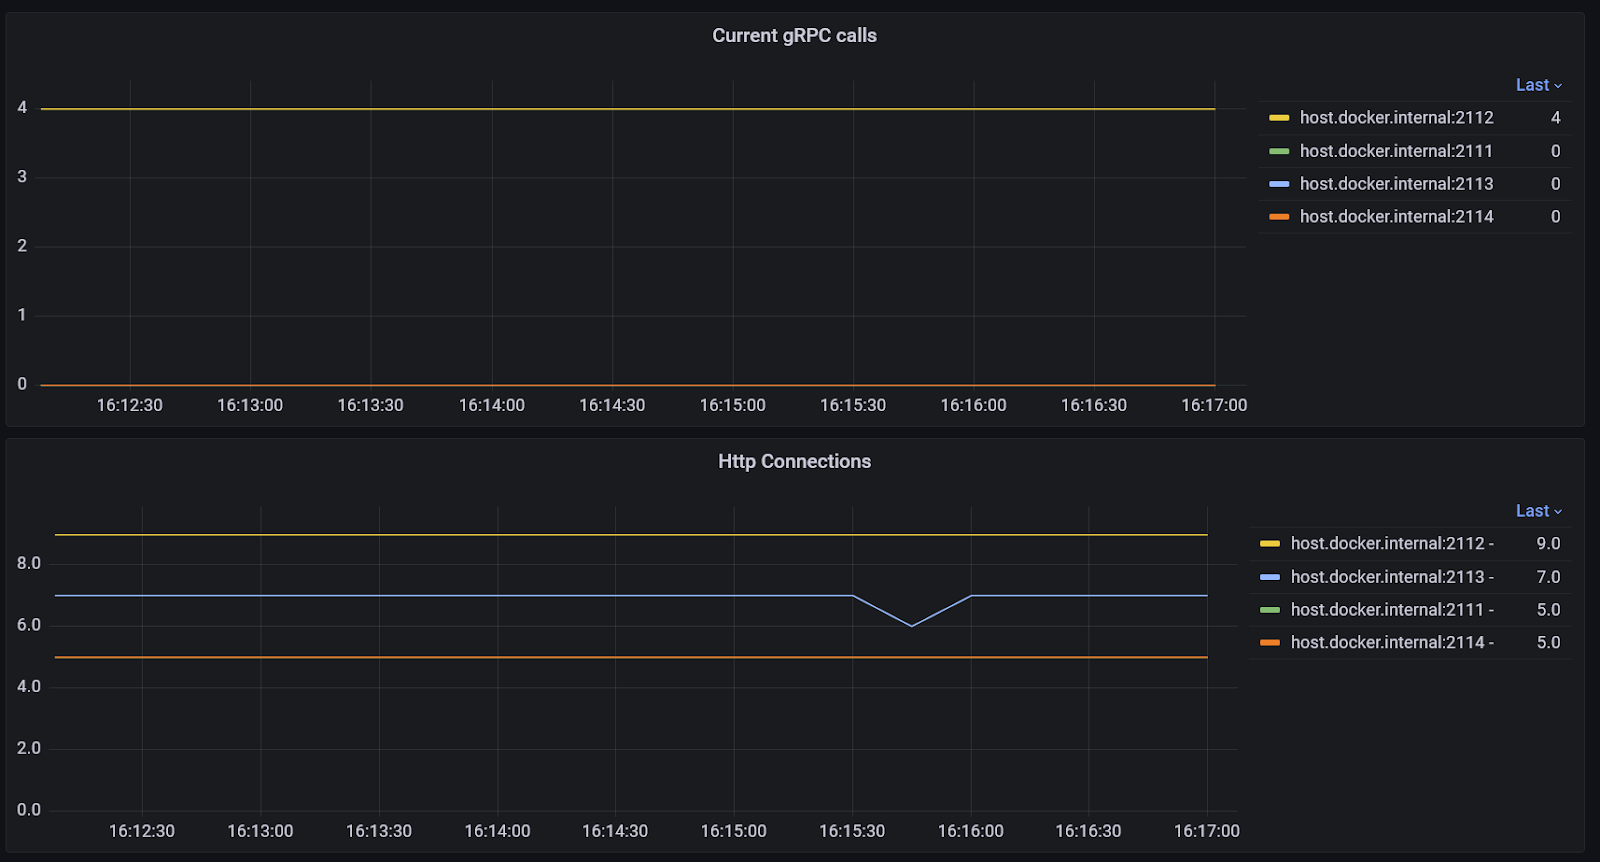
The rate of gRPC calls, histograms of durations, and the number of current calls and HTTP connections are available.
GC
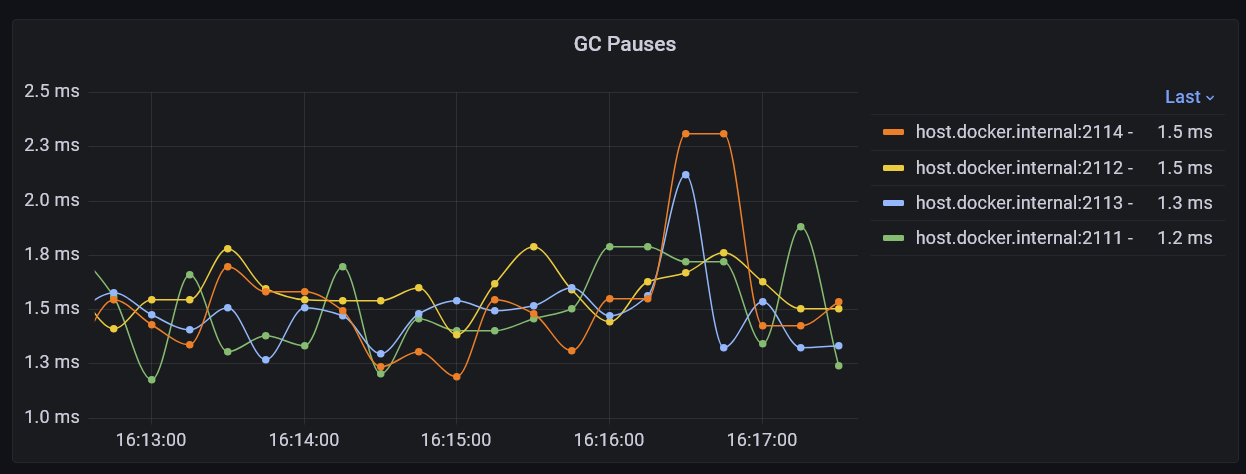
We record several metrics about the activities of the garbage collector. An interesting one displayed above is the recent maximum time that the GC has suspended the execution engine for.
Process
We haven't yet created panels for all of these, but assorted metrics are available. See the documentation for details
Queues
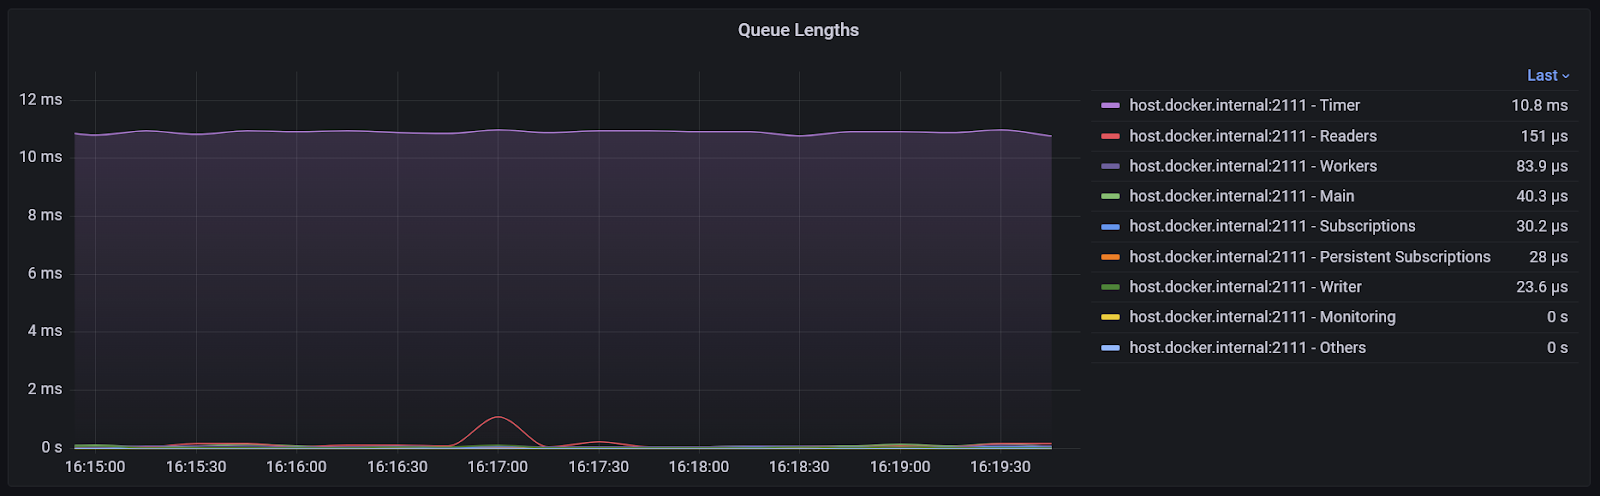
How long the queues are (in seconds. Specifically, for a non-empty queue, this is a recent maximum of how long items dequeued from the queue spent in the queue). These should always be short.
Status Timelines
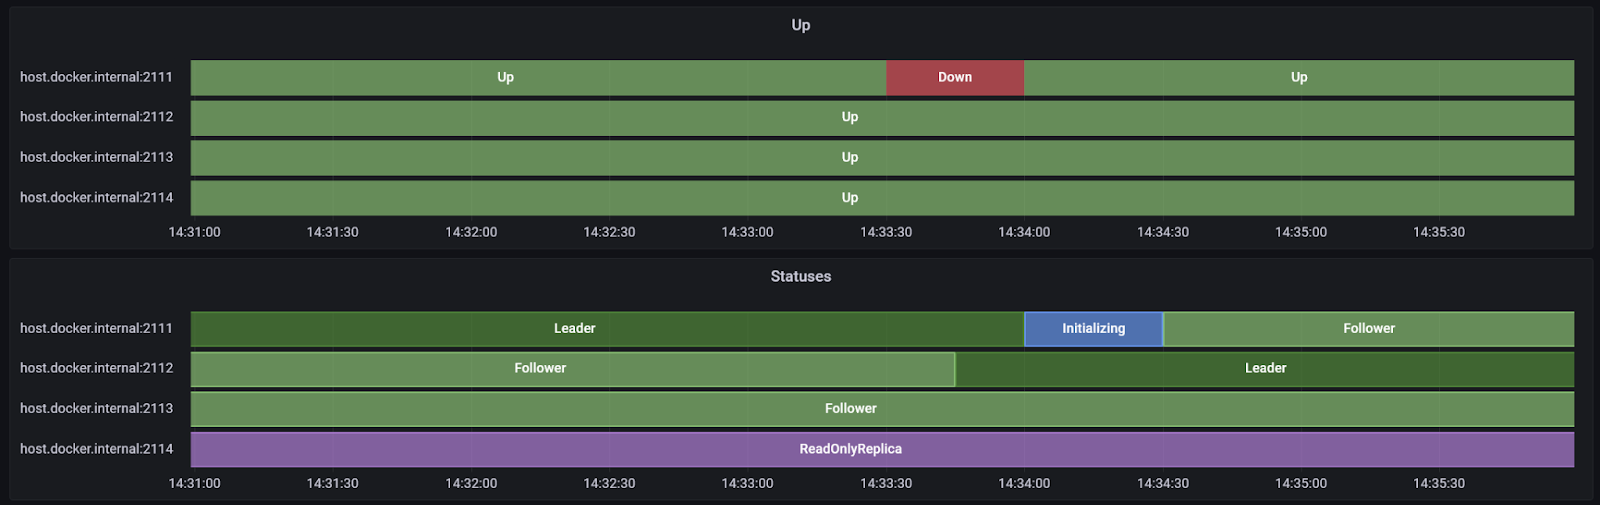
These snazzy graphs show the up/down state of each node over time, as well as its role in the cluster.
Other similar graphs in the dashboard show over time whether there were
- index operations (merge or scavenge) or
- scavenge operations and what phase they were in.
Storage Writer
Flush size and duration are available. More information is available in the documentation.
System
We haven't yet created panels for all of these, but assorted metrics are available. See the documentation for details.
Alerts
We hope to offer more precise guidance in the future, but for now these are some ideas for alerts that are worth considering. The thresholds will depend to some degree on your use case. As a starting point you can measure the typical values and configure alerts to detect if they change substantially.
- Low disk space
- High Replication Lag
- High rate of failed gRPC calls
- Node down
- Node State outside of Leader/Follower/ReadOnlyReplica
- Long queue lengths
- Unusually high sustained disk activity
Conclusion
Metrics are now much easier to consume from EventStoreDB than they used to be. Please give v23.10 a try and let us know what you think! More information about v23.10 can be found in the release notes.